
See Sites Where They Actually Are
Real estate is geography. MyDealTeams puts your locations, candidate sites, trade areas, demographics, and competitors on the same interactive map — so the right context is one click away.
Why Maps Are Usually an Afterthought
Most CRE platforms either skip mapping or charge extra for a half-baked one.
Static map images
An image of a map isn't a map. You can't pan, zoom, or query it.
Disconnected from data
The map opens in a separate tool, with no link back to the underlying property record.
No trade-area context
Without trade areas, demographics, and competitors, the dot on the map is just a dot.
What MyDealTeams Does
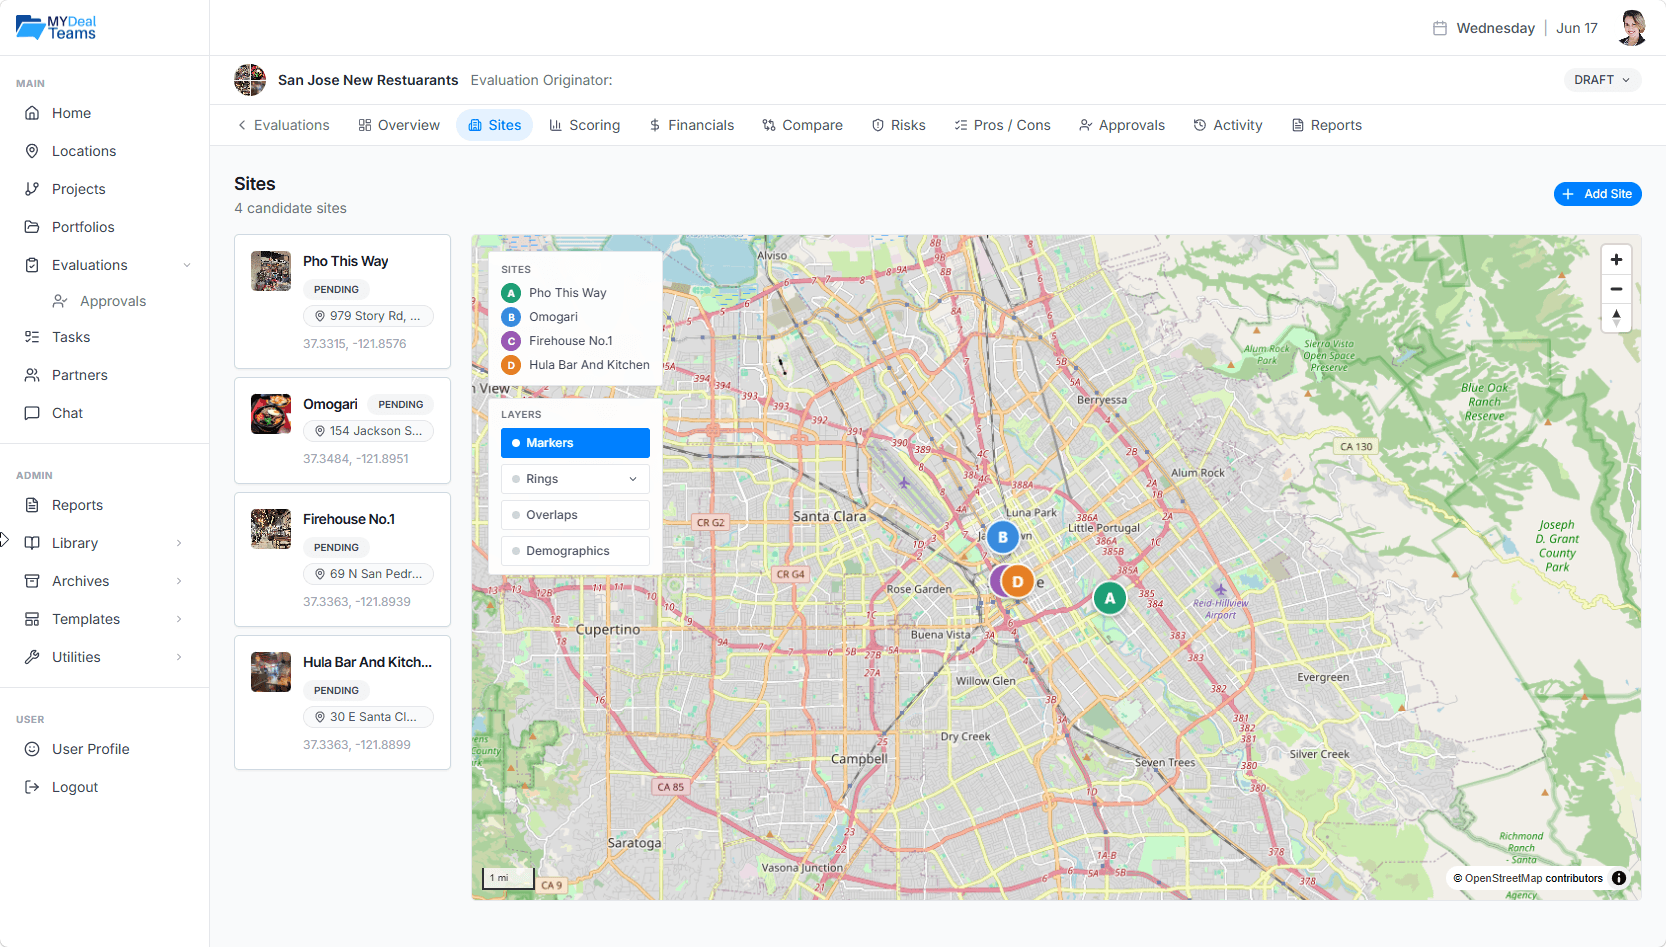
Maps are built into every location, project, portfolio, and evaluation.
Interactive maps everywhere
Pan, zoom, and click on any location to drill into its full record.
Trade-area overlays
Rings, drive-times, and custom boundaries layered onto every site.
Demographic overlays
Color-code by population density, household income, or any demographic variable.
Competitor and POI data
See competitors and points of interest in the trade area — no separate subscription.
Bulk site visualization
Put dozens of candidate sites on one map for portfolio-wide patterns.
Built on open standards
MapLibre + OpenStreetMap base layers — no proprietary lock-in.
How Teams Use It
Trade-area analysis
Compare 1, 3, and 5-mile trade areas with demographic overlays for every candidate.
Competitor mapping
See who else is in the trade area before you write the LOI.
Portfolio review
Look at your entire portfolio on one map to spot whitespace and overlap.